
Roof Drainage
58% of designers canvassed at a recent webinar had experienced troubles with flooding internal gutters. This is not surprising, because gutters designed in accordance with the Acceptable Solution, E1/AS1, are designed to fail.
Limitations of E1/AS1
At the core of this problem is the rainfall intensity calculations; the main reasons for the discrepancy are duration periods, and recurrence intervals.
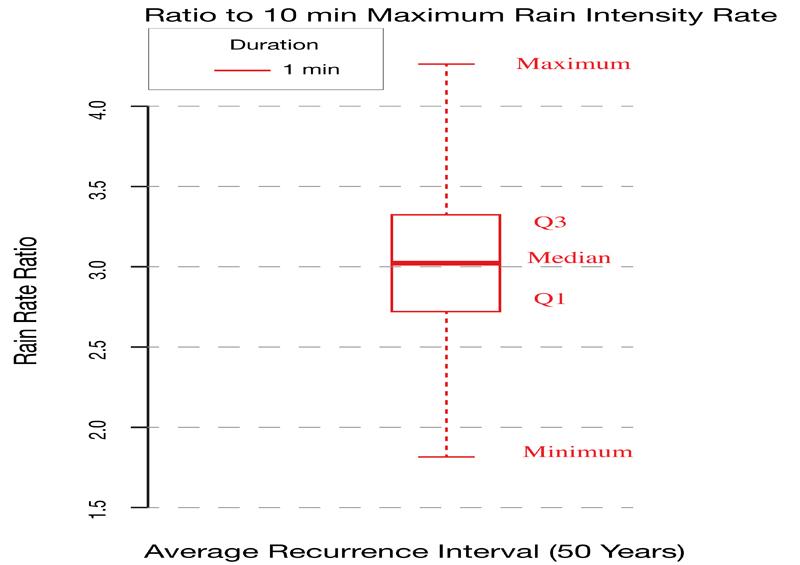
E1/AS1 uses rainfall intensity over a 10-minute period. That may be fine for ground water, but roofs can flood in a very short period. Measured over a 1-minute period, rain intensity may be as much as 4.4 times as much as the 10-minute intensity.
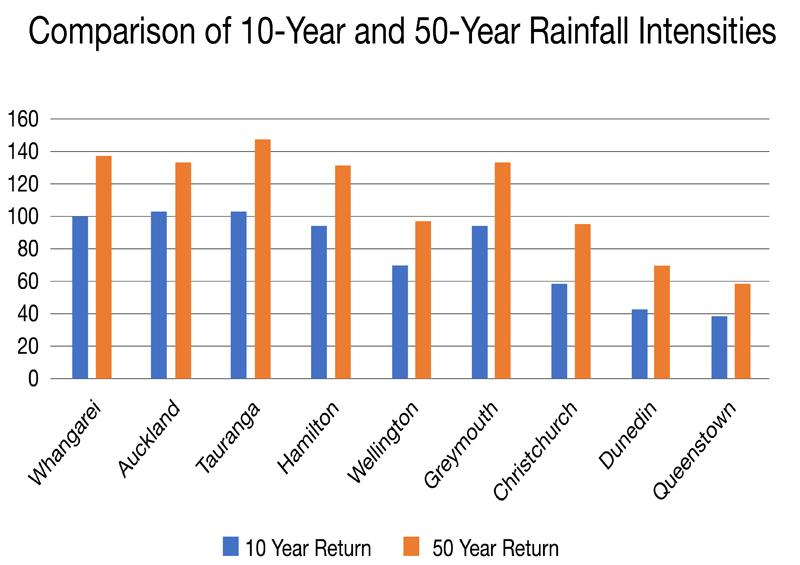
E1 requires buildings to have no more than 2% probability of flooding. That requires the use of 50-year recurrence intervals for rainfall intensity. Yet the rainfall charts in E1/.AS1 are for 10 year return intervals. That is responsible for another 34% variation in rain intensity.
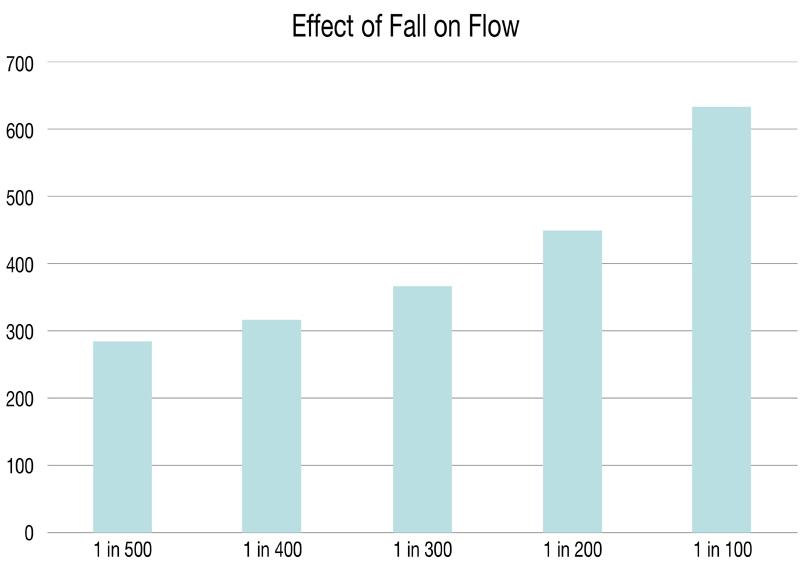
The problems do not end there. By working solely off the roof plan area, E1/AS1 makes no provision for water coming off an adjacent wall, which can have a significant effect on catchment area. It also has no minimum fall for gutters, which in turn can affect water flow by over 100%
Code of Practice Roof Drainage Calculator
This has been solved by the inclusion of a roof drainage calculator in the Code of Practice. This uses the formulas in AS/NZS 3500, but makes the calculations for you. It also allows minor variables such as length of run, wetted perimeter, corners, to be factored into the equation. For downpipes, it takes into account the head of water above the outlet, and for valleys, it calculates the capacity of any sized valley at any fall.
The system is user friendly, users just need to enter simple information and the calculator does the rest. First, enter the address and rainfall intensity, then the type of gutter.
Here we have selected Commercial Internal gutter, so the short-term Multiplication Factor is set at 2.2. That is because water takes about 2 minutes to travel 25 metres at 3º. For Residential buildings this factor is pre-set to 3.1. For more security, these factors can be increased, but not decreased below the default. The calculator has also defaulted to no overflow along the gutter, and that there will be an overflow at the outlet.
Enter the fall, length of gutter, number of bends, and freeboard. Again, 20 mm is pre-set minimum for freeboard. Enter preferred gutter dimensions.
The answer is given, in this case the maximum capacity that can be served is 223 m2. If this is insufficient, any of the variables can be adjusted to get the required capacity.
The same address and rainfall intensity information is retained for Downpipe. Here the only required addition is head at the outlet. Here’s a tip, check the internal diameter table on 5.4.2 before you start. Did you know that a 200 mm PVC round downpipe has an internal Diameter of only 178mm?
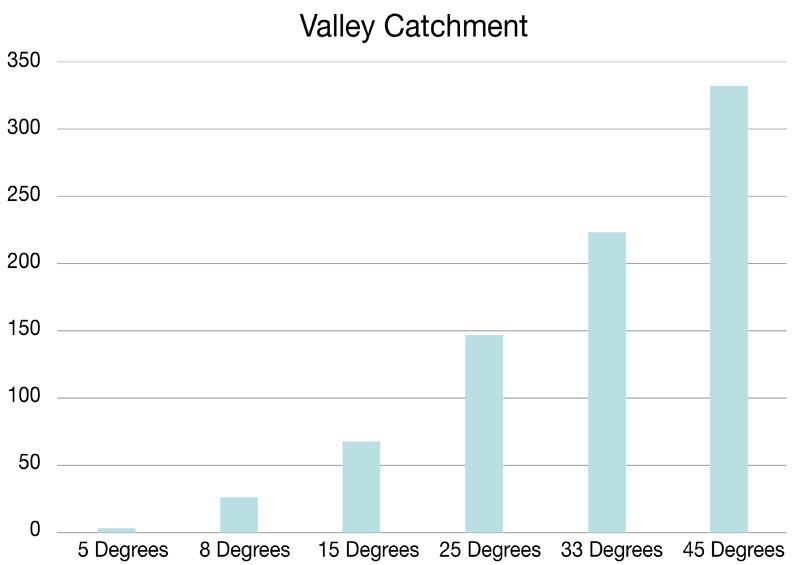
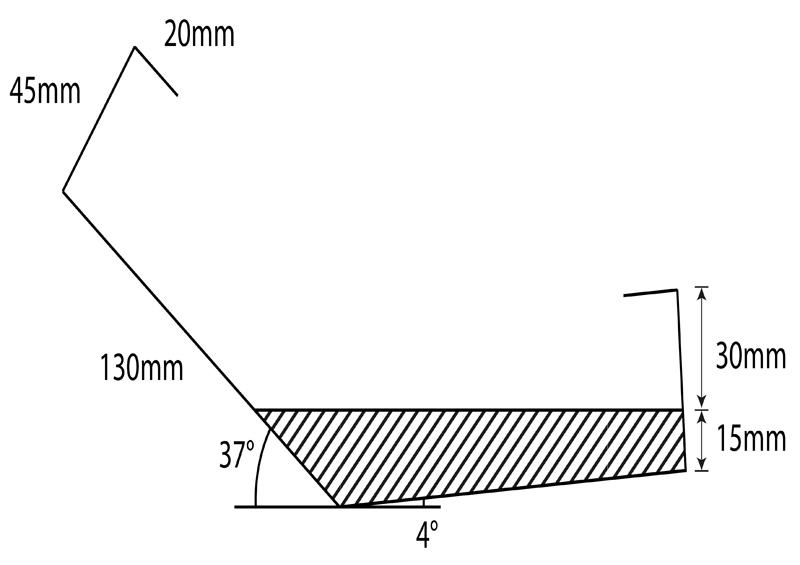
If valleys are required, enter roof pitch, valley width and valley up stand height. The output will give allowable catchment, and also give internal angle for accurate manufacture.
Comparisons to E1/AS1 and E2/AS1
Compared to E1/AS1, the internal gutter calculations will be much more conservative using the COP. External gutters with overflows will be a little more conservative, and external gutters without overflows can also be calculated. Downpipes again will be similar, but are designed according to the site-specific rainfall. Valleys agree with the E2/AS1 table at 8°, but again are site-specific and can be sized to suit pitches above and below 8°.
This has already proven to be very popular with designers, but there is more to come. E2/AS1 has limitations on spreader catchment and catchment behind penetrations, expressed as simple tables. This means variations in rainfall, shape of the profile, pitch of the roof, and length of run cannot be taken into account. The next update of the COP,will have a calculator for those also.
Another upgrade is for asymmetrical valleys, where the two roofs discharging into a valley are at different pitches. Not only is there a perceived risk of water coming down the steep side overshooting the lower side, but tipping a valley on its side greatly reduces cross section area. This is a much more complex calculation and the next update will be able to resolve this increasingly occurrent problem.