
Gutter and Downpipe Design
We often hear about internal gutters flooding. This is not because they are inherently unsafe, it is because, using the Acceptable Solution, they are designed to fail!
On 1st November the updated Code of Practice section on Roof Drainage was released. This was the most challenging section we have tackled in the current V3 revisions
Normally we try and parallel the Acceptable Solutions closely, and focus on offering solutions for situations not covered by the Acceptable Solution. The reason for this is that were we to disagree, if someone followed the COP and it disagreed from the Acceptable solution, we could lead them into a dispute with the TA that they may not win. So, where we can live with it, we sometimes concur with an Acceptable Solution even where we believe it is overly conservative.
But Roof Drainage is different, in this section we are far more conservative than the Acceptable Solutions. Try as we did, we simply could not justify publishing gutter and downpipe recommendations in compliance with E1/AS1, as we believe them to be dangerously unconservative.
Why we differ from E1/AS1
So why are we different? Our major points of difference are:
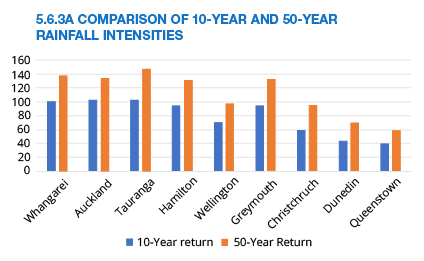
- Average return interval. The Building Code says that buildings must have less than a 2% probability of flooding. That requires using rainfall intensity with a return period of 50 years. Yet the charts in E1/AS1 are for a 10-year return period.
- The COP uses the 50-year ARI figures; depending on location that is a difference of close to 40%.
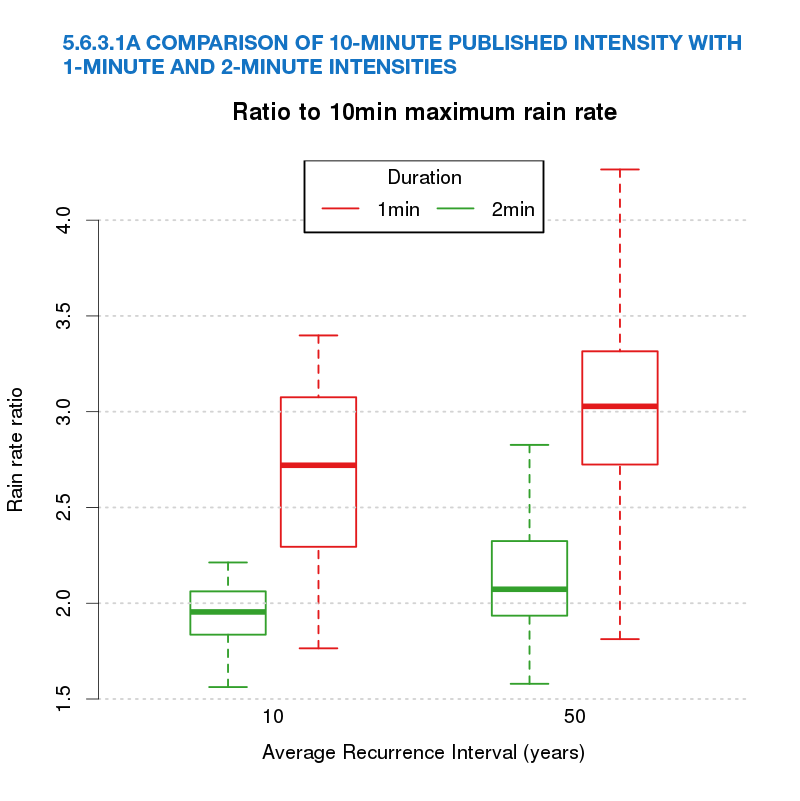
- Short term Rainfall Intensity. E1/AS1 uses the maximum intensity over a ten-minute period. That may be fine for ground drains where flash downpours take longer to reach the drainage channel, but is inadequate for roofs, where flooding can occur in less than 1 minute.
Graph 5.6.3.1A shows the difference between 1-minute and 2-minute intensities, compared with the 10-minute intensity used in E1/AS1. The horizontal line shows the median, the box represents the upper and lower quartiles, and the dotted line the complete range. It shows that a 1-minute intensity can be as much as 4.3 times the intensity over a ten-minute period.
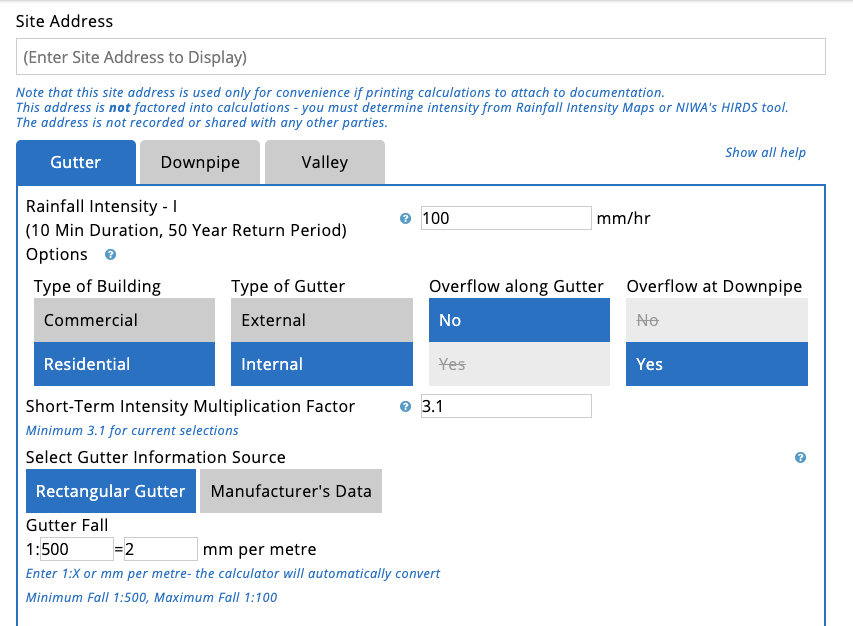
The COP calculator uses 10-minute intensities, because that is what is readily available, and applies a short-term intensity multiplier to convert them to a shorter-term intensity. For instance, for Residential Internal it defaults to a multiplier of 3.1, designers can opt to increase this if the risk of a 50-year flood cannot be tolerated, but it cannot be reduced. Industrial Internal defaults to 2.2, as on most commercial sized jobs the travel time of rainfall will be closer to 2 minutes. External gutters have various factors depending on the assessed consequence of occasional overflowing.
All the above variables are interactive, you can make the changes on-line and see what effect they have on allowable catchment areas.
The above two inconsistencies alone account for much of our divergence, but there are others. So, this time we followed our own path, and with the help of expert advice from Opus, have published our own solutions. These are consistent with the Standard AS/NZS 3500 but employ worksheets to simplify the calculations contained in that complex document.
If all you want is a design that merely complies with the requirements for a consent, use E1/AS1, but if you desire a design that won’t flood, consult the COP.
The COP offers More Options
The COP recommendations also offer more options in design criteria than E1/AS1.
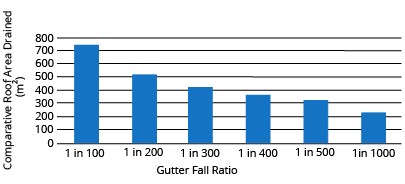
- Gutter Fall. The COP calculates capacity of internal gutters with different degrees of fall, this has a big effect on capacity. E1/AS1 has no minimum fall for internal gutters, E2/AS1 minimum fall must be 1:100 (10 mm per metre), which is often unachievable. The COP has a minimum fall of 1:500, but allows designers to calculate the extra capacity they can achieve by increasing the fall. The COP recommends a 1:200 fall (5 mm in 1 m), as it will improve drainage and self-cleaning.
- Freeboard. Again E1/AS1 and E2/AS1 disagree. E1/AS1 has no requirement for freeboard on gutters, in accordance with E2/AS1 the COP has minimum 20 mm freeboard for internal gutters. Valleys have a minimum 15 mm freeboard, 20 mm for gutters at less than 8°.
- External gutters. It gives options for external gutters with and without overflow.
- Internal Gutters. It calculates the effect of the wetted area on water flow. The less wetted area the freer the flow, the optimal ratio is width = 2x height.
- Valleys. It gives maximum catchment for common valleys at pitches other than the minimum pitches given in E1/AS1. The capacity of custom-sized valleys can also be calculated.
- Downpipes. The downpipe capacities are variable according to the rainfall intensity of a location, and options are given for downpipes with and without overflow.
- Rainfall. The COP gives the ability to calculate capacity in areas where rainfall intensity is less than 100 mm/hr. This particularly affects much of the South Island. The effects of 90° bends in internal and external gutters is also calculated.
Interactive Worksheet
The heart of the COP section on Roof Drainage is the capacity calculator.
We still have some tables in the COP, but accurate design is most easily achievable using the interactive worksheets, which calculates roof area drainage capacity of a specific system.
The following inputs are required:
- Enter site address, and select gutter from the tabs
- Enter 50-year 10-minute rainfall Intensity. This can be taken off maps provided, but is more accurately given on HIRDS website. Do not use the E2/AS1 maps, they are outdated and are only for 10-year return period. https://hirds.niwa.co.nz/
- Enter type of gutter. This effects pre-set minimum factors such as short term intensity.
- Enter gutter shape. This can be dimensions of a folded rectangular gutter or manufacturers data (cross-section area and wetted surface) for proprietary spouting.
- Enter gutter fall. This defaults to 1:500 (2 mm/m) and can be increased up to 1:100 (10 mm/m). The maximum catchment for the design is then given. If the design catchment exceeds this, gutter design, slope, or catchment area can be altered to find a working combination. Similar inputs in downpipe and (if required) valley calculations can be entered, for which the rainfall intensity input on the gutter sheet is retained.
- The site details are retained when the Downpipe and Valley tabs are subsequently selected.
The worksheets can then be printed or electronically attached to a consent application.
Future Development
For the next update we will be extending this worksheet to provide maximum length of run for a given profile and pitch, and for calculating the capacity of a pan beside a penetration to accommodate discharge from the catchment area above the penetration.